Does School Enrollment and GDP per Capita Affect the Fertility Rate?

School entrollment, GDP per capita and fertiliy rate
The purpose of this project is to analyze the relationship between school enrollment, GDP per capita and fertility rate by regions.
Loading, inspecting and joining datasets
Loading data
The first step, is to load the data: I load the worldbank data from the package wbstats. Because I don’t need all the data I select the indicators I am interested in and filter by indicator, start- and end-date. Last but not least, I create the dataset countries from the wbstats package.
# get World bank data using wbstats
indicators <- c("SP.DYN.TFRT.IN","SE.PRM.NENR", "SH.DYN.MORT", "NY.GDP.PCAP.KD")

library(wbstats)

worldbank_data <- wb_data(country="countries_only", #countries only- no aggregates like Latin America, Europe, etc.
                          indicator = indicators,
                          start_date = 1960,
                          end_date = 2016)

# get a dataframe of information regarding countries, indicators, sources, regions, indicator topics, lending types, income levels,  from the World Bank API
countries <-  wbstats::wb_cachelist$countries
Tidying datasets
I change the data type of the variable “year” in life_expectancy_clean to numerical ones to be able to join them with the worlbank data. I change also the name of the variables of the worldbank data to more meaningful names.
To control the changes made, I skim the cleaned datasets.
worldbank_data_clean <- worldbank_data %>%
  #I change the names to have more meaningful names, but I don't use pivot_longer as this is not needed to resolve the questions
  rename("GDP_per_capita"=NY.GDP.PCAP.KD,
         "School_enrollment_primary"= SE.PRM.NENR,
         "Mortality_rate_under5"=SH.DYN.MORT,
         "Fertility_rate" =SP.DYN.TFRT.IN,
         "year"=date)

#I check if the data types have been changed
skim(worldbank_data_clean)
Joining datasets
Now, I add the region to the worldbank data:
# adding regions and countryname from the datset countries
worldbank_data_region <- worldbank_data_clean %>%
  left_join(select(countries, c("iso3c", "region")), by= c("iso3c"))

unique(worldbank_data_region[is.na(worldbank_data_region$region),]$country) #identify missing values by region
## character(0)All observations of the worlbank data have a region assigned.
What is the relationship between fertility rate and GDP per capita?
To answer the question I generate a scatterplot with a smoothing line to report my results and I facet by region.
ggplot(worldbank_data_region, aes(x=GDP_per_capita, y=Fertility_rate))+
geom_point(alpha=0.1, na.rm=TRUE)+
geom_smooth(na.rm=TRUE)+
facet_wrap(~region, nrow =2, scales = "free")+ #changed scale
theme_fivethirtyeight()+
theme(axis.title = element_text())+
labs(x="GDP Per Capita", y= "Fertility Rate", title="The Fertility Rate in Rich Countries is Decreasing", subtitle = "Relationship between fertility rate (average number of children per woman) and GDP per capita ($)")+
scale_x_continuous(labels = scales::dollar)+ #added dollar signs
NULL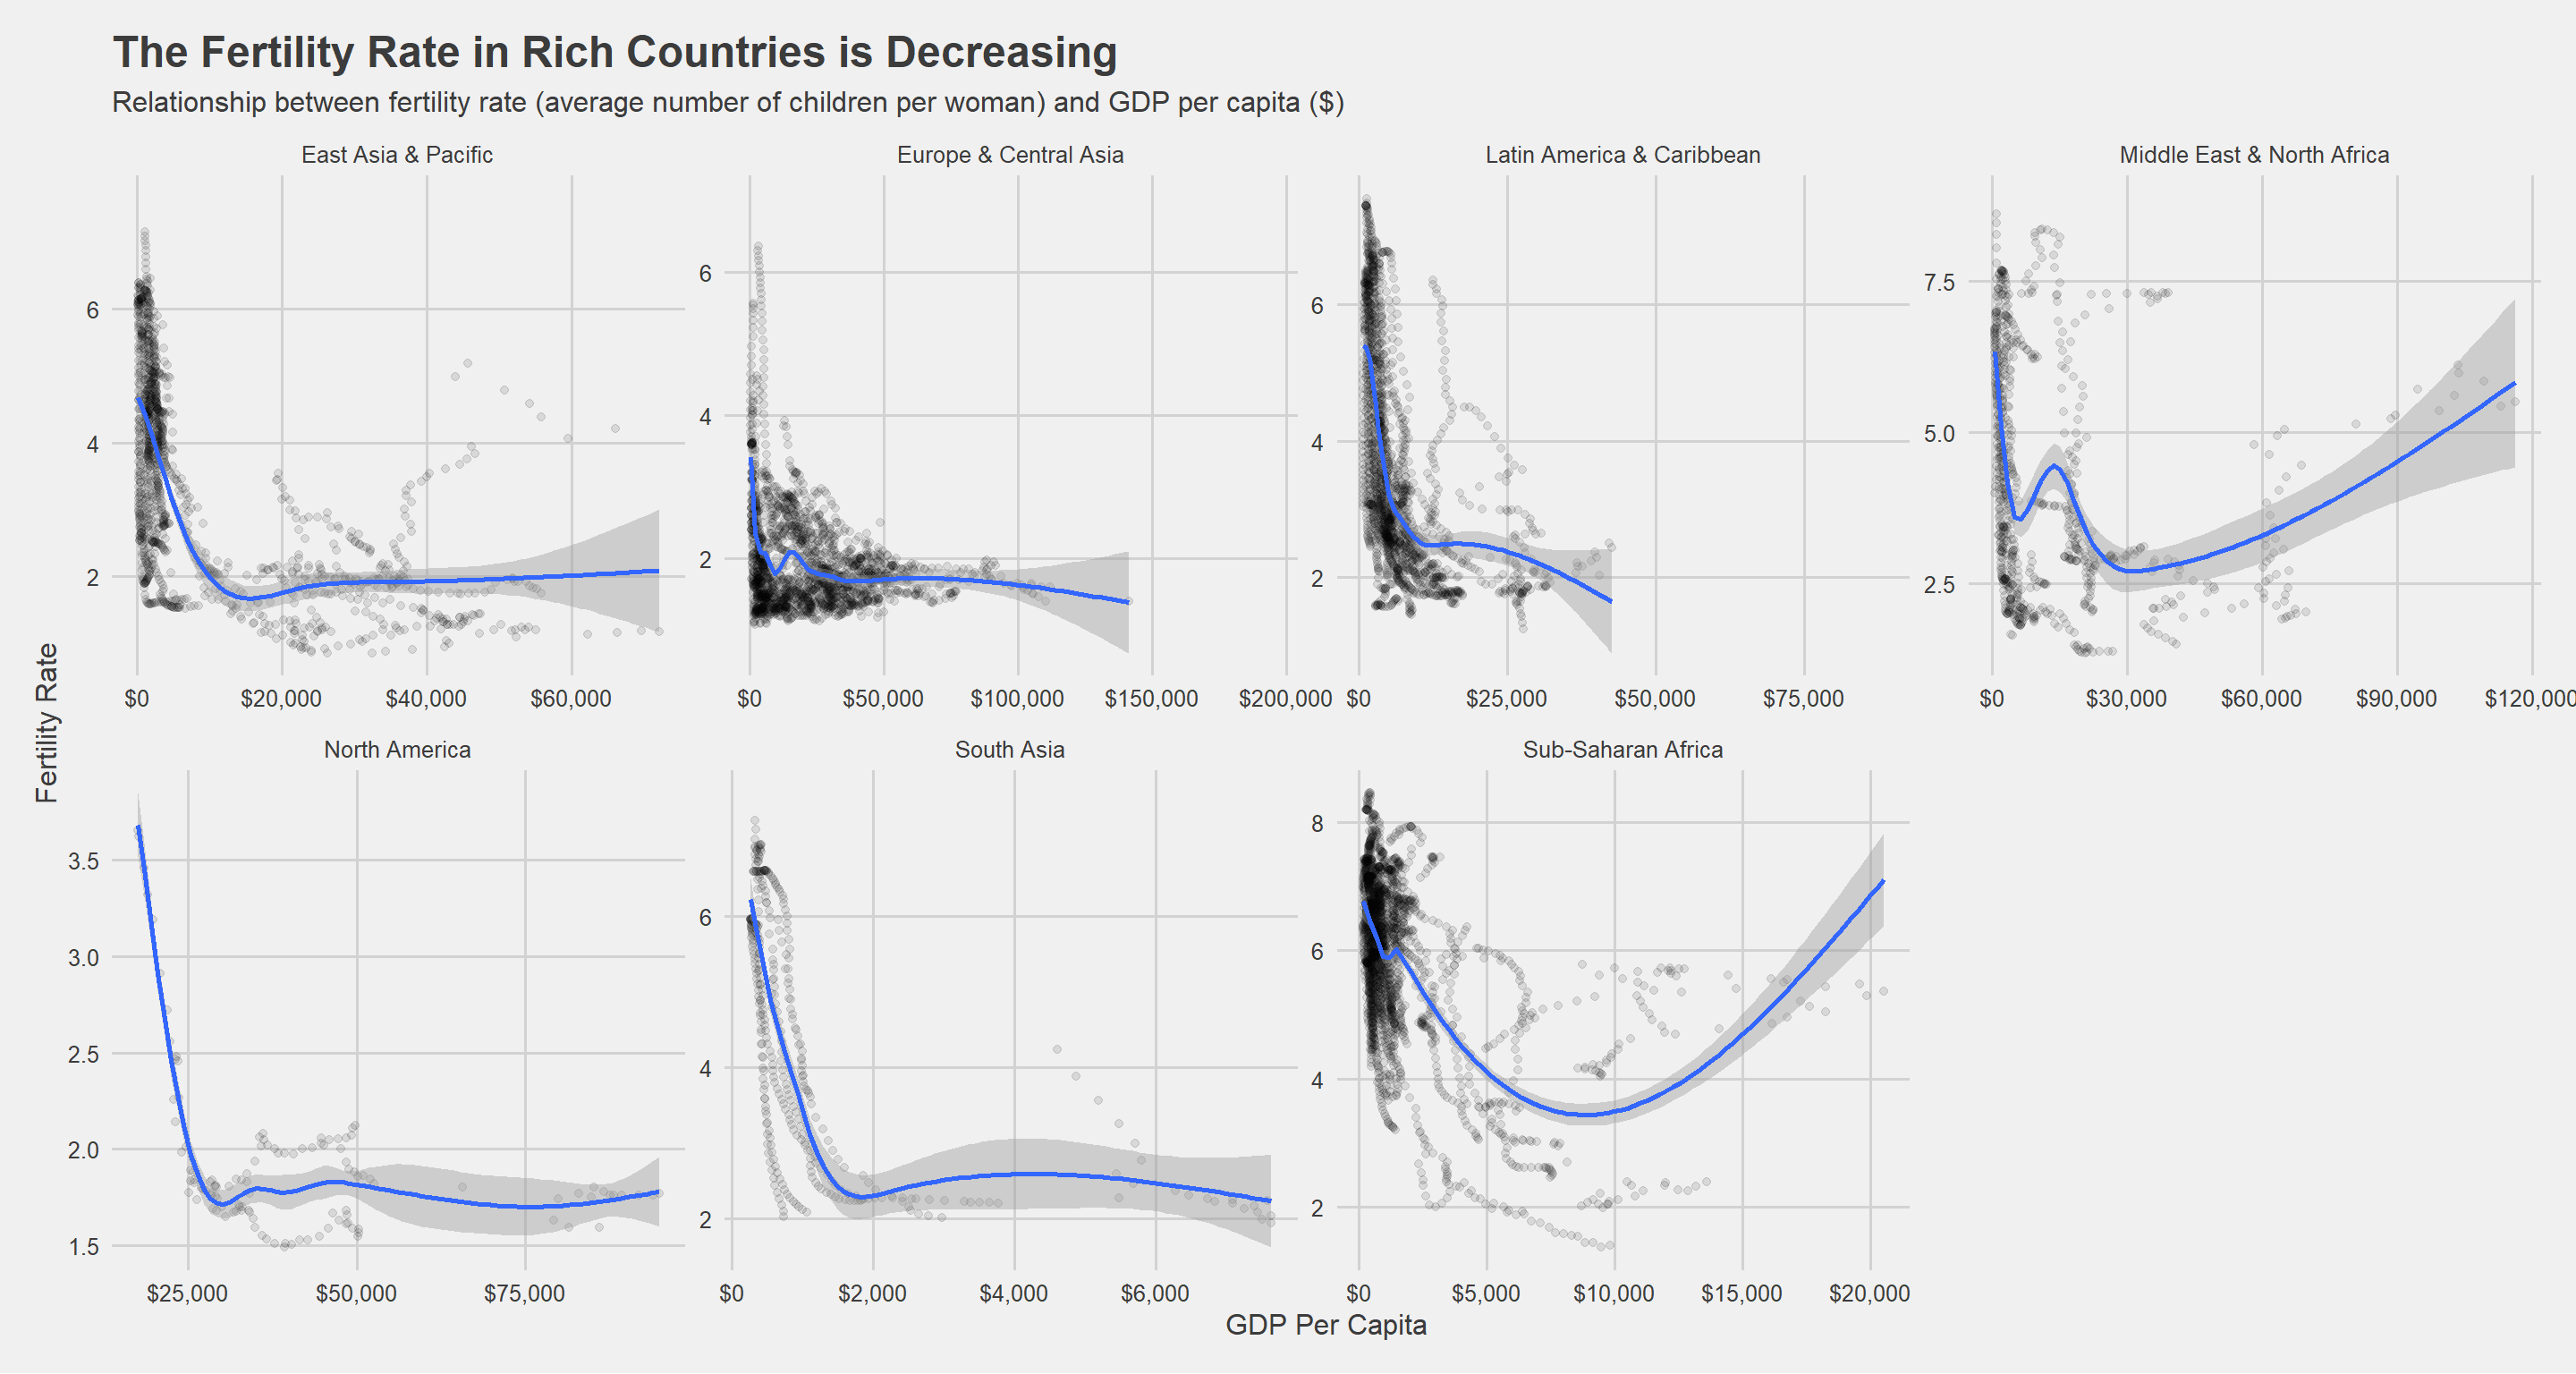 These faceted plots demonstrate a clear relationship for all regions besides Middle East & North Africa and Sub-Saharan Africa. Evidently, in all other regions, fertility rate falls sharply as GDP per capita rises, until a certain GDP threshold, at which point further increases in GDP/capita is no longer correlated with drastic changes in fertility rate. This suggests a clear negative correlation between fertility, but only in countries with relatively low GDP per capita, where GDP increases have a marked effect on fertility. Indeed, I find that as GDP per capita rises, healthcare and education access and provision improves, child mortality rates fall, and families are capable of raising the number of children they desire without the need to have many more children (high fertility rates) to hedge against potential risks.
In the two regional outliers, I find that while at relatively low levels of GDP per capita, GDP per capita increases are correlated with decreased fertility rates, past a certain point increased GDP per capita is positively correlated with fertility rates. This u-shaped relationship is explained by the fact that in early stages of development, families choose to have many children to ‘hedge’ against high mortality rates, since children are assets in the labour market. Therefore, in countries with relatively low levels of GDP per capita, fertility rates are high. However, as GDP per capita increases, families can afford better healthcare and nutrition and therefore child mortality falls, meaning fertility rates decrease in line with mortality rates. However, once GDP per capita has reached a relatively high point, families are then sufficiently well-off to sustain larger families, and children become luxury goods, meaning fertility rates increase with disposable income.
Is there a relationship between primary school enrollment and fertility rate?
While it is common sense that school enrollment for women has plenty of advantages, some claim that it has a negative impasct on the fertility rate. I want to find out if these negative relationship exists. To do that I create a scatterplot between primary school and fertility rate:
p1 <- ggplot(worldbank_data_region, aes(x=School_enrollment_primary, y=Fertility_rate))+
geom_point(alpha=0.3)+ #creating a scatterplot
geom_smooth(se = FALSE, na.rm=TRUE, size=0.3, colour ="red")+ #adding a correlation
theme_fivethirtyeight()+ # adding a theme
theme(axis.title = element_text(), legend.title=element_blank())+
labs(x="Primary School Enrollment (%)", y= "Fertility Rate", subtitle = "Relationship between school enrollment and fertility rate \n between 1960 and 2016 across all regions") + scale_x_continuous(breaks=seq(0, 100, by = 10), limits=c(0,100)) + scale_y_continuous(breaks=seq(2, 7, by = 1), limits=c(2,7))+
NULL
p2 <-ggplot(worldbank_data_region, aes(x=School_enrollment_primary, y=Fertility_rate, colour=region))+
geom_smooth(se = FALSE, na.rm=TRUE, size=0.3)+
theme_fivethirtyeight()+
theme(axis.title = element_text(), legend.title=element_blank())+
labs(x="Primary School Enrollment (%)", y= "Fertility Rate", subtitle = "Relationship between school enrollment and fertility rate \nbetween 1960 and 2016 by region") + scale_x_continuous(breaks=seq(0, 100, by = 10), limits=c(0,100)) + scale_y_continuous(breaks=seq(2, 7, by = 1), limits=c(2,7))
p1+p2+ plot_annotation('Primary School Enrollment is Negatively Correlated with Fertility Rate Across All Regions')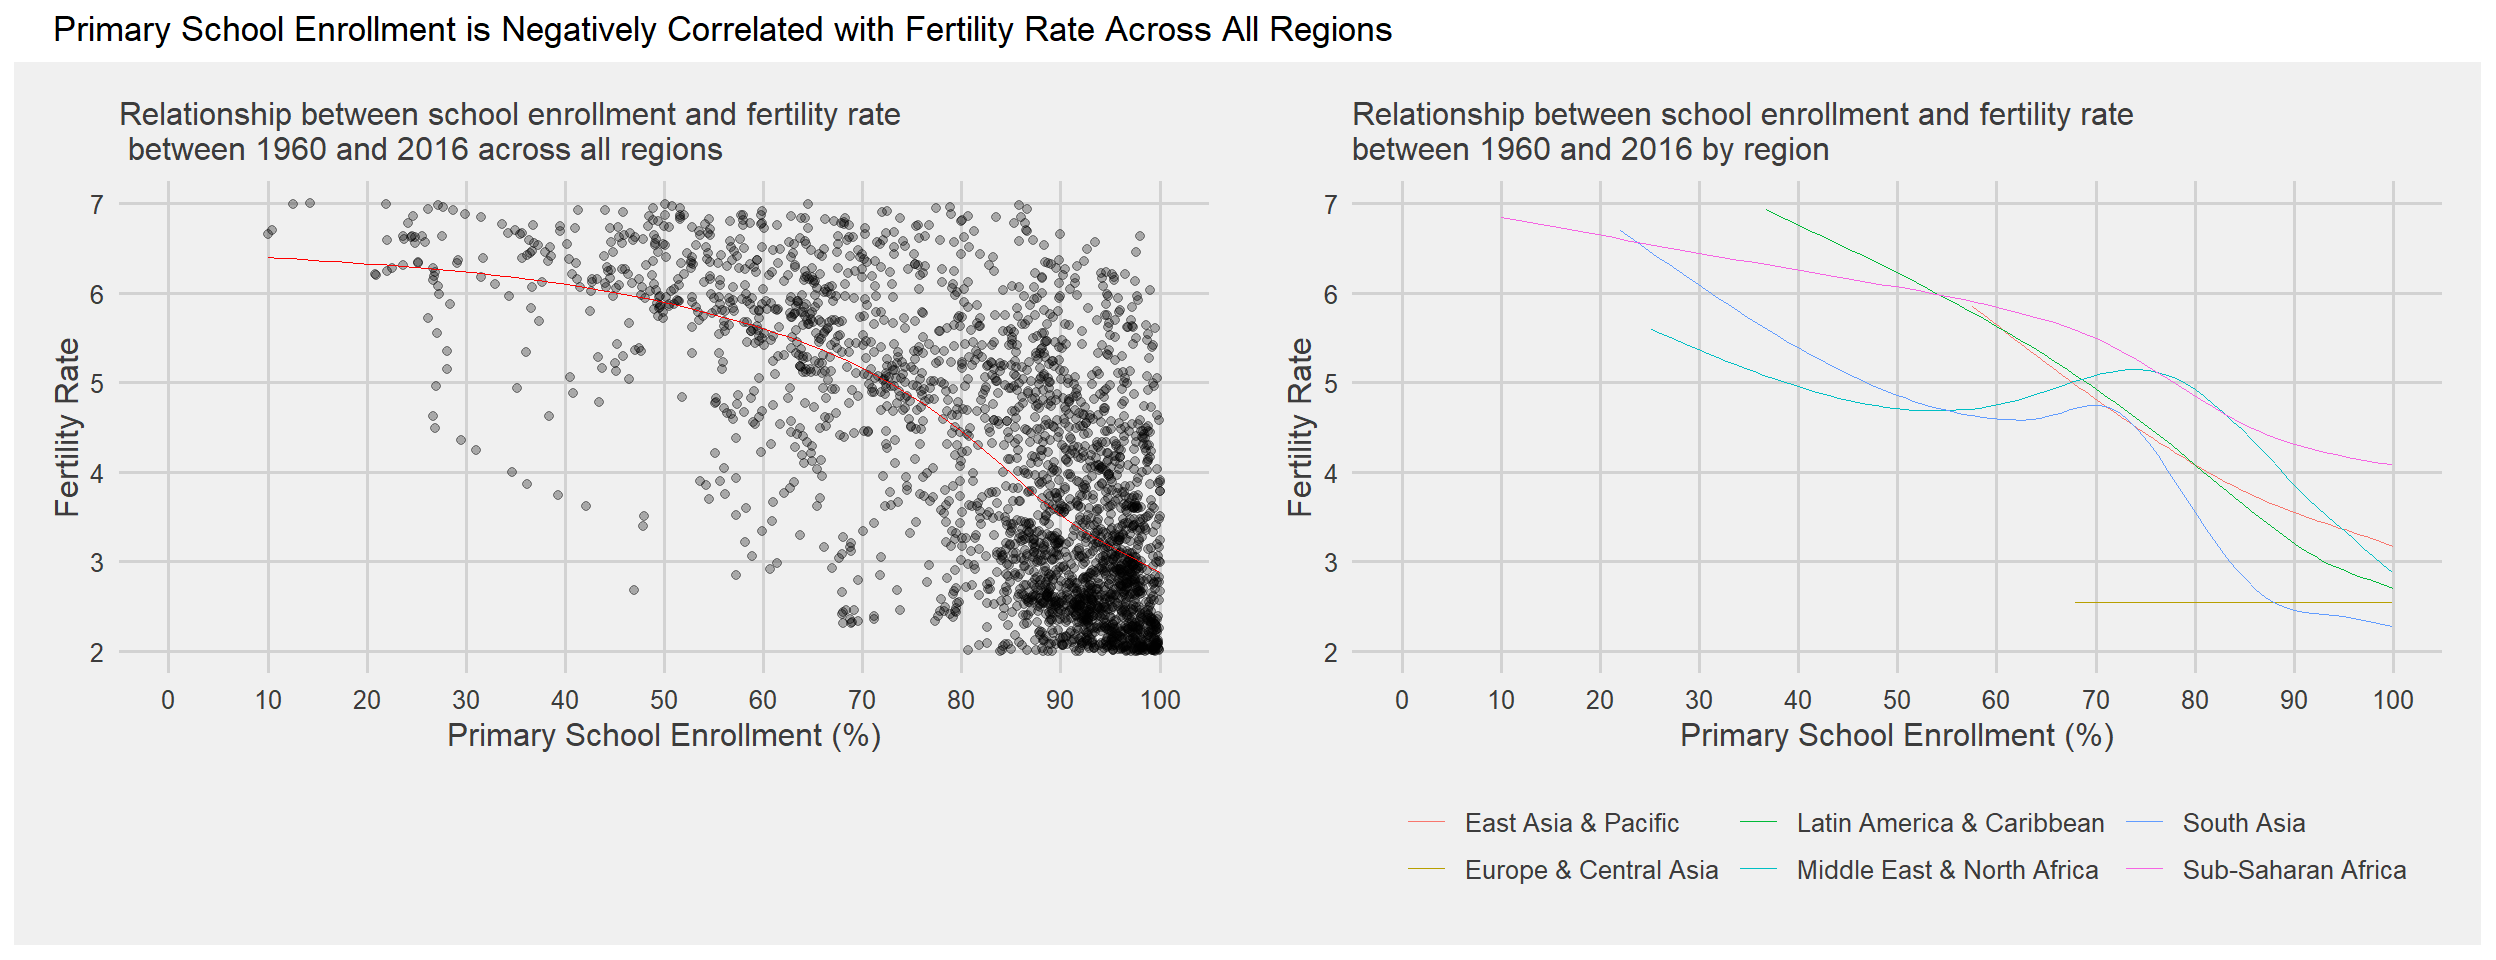 The scatterplots above depict a strong relationship between fertility rate and primary school enrollment. On average, across all regions besides Europe and Central Asia, a higher school enrollment rate is correlated with a lower fertility rate. This is not surprising, as with an education women have greater job opportunities and are less dependent on raising a family to provide children for family labor. Furthermore, educated women adopt modern birth control methods more often than uneducated women.
This relationship is most pronounced in the Middle East & North Africa and South Asia, which shows the steepest negative correlation between primary school enrollment and fertility, though only in the 75%-100% school enrollment interval. This demonstrates how the relationship between the two variables is relatively weak at lower levels of school enrollment, and becomes pronounced only when school enrollment increases from an already relatively high level, i.e. from around 75% enrollment to 100% enrollment. Indeed, while increasing from 25% to 75% enrollment is correlated with a decrease of approximately 1 in fertility rate, increasing from 75% to 100% school enrollment is correlated with a decrease in fertility rate of approximately 2.
This implies that fertility rates are only consistently and strongly negatively correlated with primary school enrollment once enrollment has surpassed a certain threshold, which appears to be approximately 75%. This suggests that women only really start to choose not to have children once a sufficiently large portion of their country/region is educated, though the reason for this is unclear.